Prologue · Senior Data Analyst at Uber Eats, Bangalore

I find the number that’s wrong before anyone makes a decision on it.

I build the checks, alerts and dashboards that make data trustworthy enough to act on: reliable systems, statistical validation and decision-support journeys across markets. I’ve been doing it since 2019, across automotive, manufacturing and food delivery.

  • Business intelligence
  • Analytics engineering
  • Data quality & reliability
  • Statistical analytics
  • Data automation
  • AI-assisted analytics
Open to senior analyst roles

Try it. Is one of these months wrong? Look first, then switch on a baseline.

A growing metric with one value outside its expected range A monthly line rises steadily inside a shaded band showing its rolling baseline. Month 19 drops well below the band and is flagged. Outside its 6-month baseline. Worth a look.
Illustrative series. By eye, one dip is easy to explain away.

The 30-second version

Snapshot

Countries in scope
24
Delivery platforms tracked
20+
Faster heaviest pages after a rebuild I led
~65%
Lines of production analytics code, shipped with AI coding agents
~20k

Who I am

I treat metric trust as the product

I’m a senior data analyst who treats metric trust as the product. Since 2019 I’ve worked on one problem across automotive, manufacturing and food delivery: can this number survive a decision?

At Uber Eats I own competitive merchandise intelligence analytics across 24 countries and 20+ platforms, as an Indium consultant embedded with Global Strategy Planning. I define the metrics operations use for positioning, prove them with checks and alerts, and ship the Flask systems that make the story self-serve. I work daily with AI coding agents, under specs, decision logs and tests.

Data is only valuable when it is reliable, understandable and actionable.
Title
Senior Data Analyst · Analytics Engineering · Business Intelligence
Now
Uber Eats, Bangalore, via Indium, with Global Strategy Planning
Scope
24 countries, 20+ competitor delivery platforms
Arc
Automotive OEM, Tier-1 supplier, gigafactory operations, then multi-country food-delivery intelligence
Education
Master’s in Technology Management, SRH Berlin (1.9); Bachelor’s in Automobile Engineering
Languages
English (full professional), Kannada, Hindi, German A2

How I show up

  • Metric owner I define what counts before I write the SQL.
  • Trust engineer Flags come with reasons, and a break points to one stage.
  • Product-minded analyst Journeys from scan to diagnosis to drill-down, not orphaned charts.
  • Systems builder Flask apps, monitors, alerts and tests, with about 20k lines of AI-assisted production code.
  • Stakeholder translator Plain-English root-cause notes and sign-off workflows.
  • Evidence over narrative I separate a data artefact from a real market change.

What I do

The layer between the warehouse and the decision

I build the validation, alerts and Tableau-to-Flask rebuild behind competitive intelligence, then design the scorecard journeys and root-cause packs that take a strategy lead from “something moved” to “here’s why”, without waiting on ad-hoc SQL.

  1. Trust the number Validation, alerts and observability.
  2. See why it moved Root-cause packs and stage localisation.
  3. Act the same week Not month-end discovery.

Business and competitive intelligence

Turning competitor, marketplace and operational data into strategic intelligence.

  • Competitive merchandise analysis
  • Merchant and store intelligence
  • Coverage and assortment framing
  • Orders and performance trends
  • Pricing and parity
  • Churn and new-store analysis
  • KPI development

Scorecard journeysScan the market, diagnose what moved, drill to the cause. Method only; no confidential outputs.

EvidenceUber Eats CMI, ZF commercial analytics, Tata catalogue and KPI work.

Presto, Python, Tableau, Flask
Data engineering and analytics pipelines

Reliable workflows from fragmented inputs to analysis-ready data.

  • Advanced SQL and transforms
  • Ingestion and enrichment
  • Deduplication
  • Entity matching and mapping
  • Warehouse reconciliation
  • Scheduled extracts
  • Automation

Evidence13 scheduled Presto extracts, the largest 4.6M rows. Pipeline observability across 213 tables. SQL Server and SSIS integration at Tesla.

Presto, Trino, Hive, SQL Server, Python, pandas

Data quality and reliability engineering

Identify, validate, monitor, prevent.

  • Completeness and uniqueness
  • Reconciliation
  • Statistical anomaly detection
  • Time-series validation
  • Outlier handling
  • Pipeline monitoring
  • Root-cause analysis
  • Automated alerts

EvidenceADF-routed anomaly flags, same-day alerts on 15+ ingestion tables, 14 data-quality checks, 27 unit tests.

Python, pandas, NumPy, statsmodels, SQL, pytest, Slack API

Analytics engineering and visualisation

Turning analytical logic into interactive apps and decision-support systems.

  • Tableau and Power BI
  • Python and Flask apps
  • Plotly
  • Reusable metrics layers
  • Performance optimisation
  • Self-serve analytics
  • Analyst sign-off workflows

Evidence9 Tableau dashboards and 55 calculated fields rebuilt in Flask, about 65% faster on the heaviest pages, with 8 sign-off states. 15+ Tableau dashboards at Tesla.

Tableau, Power BI, Flask, Plotly, Python, pandas, Excel (Macros/VBA), SQLite

AI and intelligent automation

AI as an accelerator, not a replacement for thinking.

  • ProductionCursor and Claude draft SQL and pandas from a written spec and speed up root-cause work. Specs, a decision log and unit tests govern what ships, across about 20k lines.
  • IndependentCaneIQ: a five-agent NotebookLM decision system for a business go/no-go.
  • ExploringLLM-API features and retrieval. Not shipped, and not claimed as production.

Cursor, Claude, NotebookLM

Business problem solving

Start from the decision, not the tool.

  • Requirements
  • Metric definition
  • Commercial analysis
  • Demand and pricing analysis
  • Root-cause analysis
  • Stakeholder communication
  • Recommendations in business language

EvidenceZF: pricing work that contributed to 25% sales growth in six months. Tata: 24% better product metadata and 90% better e-brochure data quality.

Chapter 1 · The journey

One habit, six places

Every role has come back to the same question: can we trust this number? Scroll the route from my first job to now.

  1. Tata Motors Apprentice, product marketing analytics

    My first job was cleaning up a customer-facing product catalogue. The data was wrong in ways customers noticed, so I worked with the content team to define what “correct” meant and built a monitor in Excel to keep it that way.

    • 24% more accurate product metadata
    • 90% better e-brochure data quality
  2. Berlin Master’s in Technology Management, SRH University

    I moved to Germany to study AI, data analysis and programming in R and Python, and graduated with a 1.9.

  3. ZF Group Data analyst

    I built Power BI dashboards for sales, product performance and demand. I also ran aftermarket pricing analysis and explained it to commercial teams in plain terms.

    • 25% sales growth in six months, which my pricing work contributed to
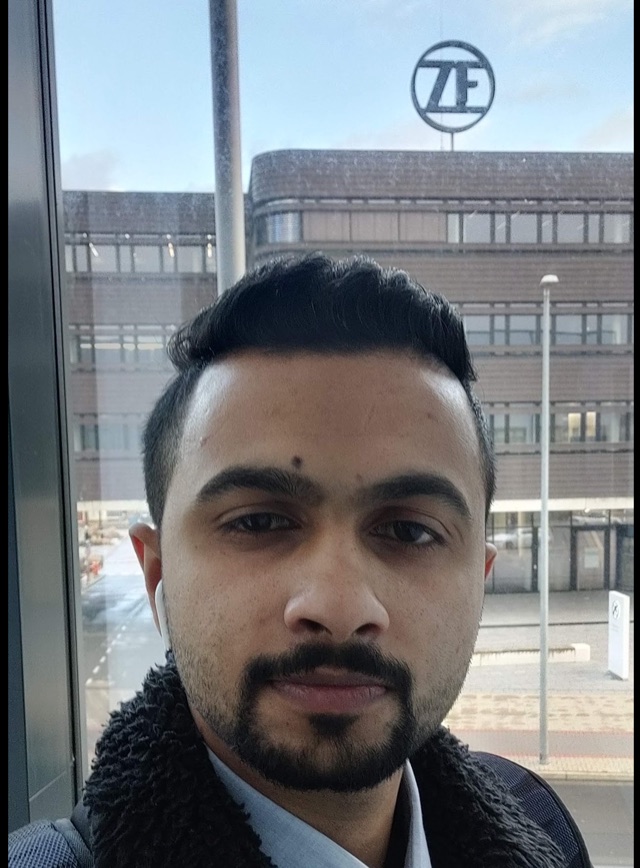
    Adarsh outside the ZF Group office in Hannover, with the ZF logo on the roof behind him
    On site at ZF Group, Hannover
  4. SRH University Data analytics assistant

    I replaced manual cohort analysis with customer-segmentation models in scikit-learn, and turned the results into Power BI views researchers could act on.

  5. Tesla Gigafactory Berlin Digital solution expert

    Production teams were reviewing spreadsheets. I connected separate production systems with SQL Server and SSIS, then gave the line shared dashboards that updated continuously.

    • 15+ Tableau dashboards used for day-to-day line decisions
    Adarsh taking a selfie in the crowd at a Tesla event, with the stage and a TESLA sign behind him
    At a Tesla event during my time at Tesla, 2024
  6. Uber Eats Senior data analyst, external consultant via Indium, Bangalore

    I work full time with Uber Eats’ Global Strategy Planning team as an external consultant employed by Indium. I own competitive merchandise intelligence (CMI) analytics across 24 countries. Operations and strategy teams make positioning decisions on these metrics, so I make sure every number is defined, validated and watched.

  7. Next

    Your team? Senior analyst, India or Europe

    I’m looking for a team where the numbers drive real decisions, and where making them trustworthy is part of the job, not an afterthought.

    Start that chapter

Chapter 2 · The work

Case files

Four systems I built at Uber, plus one decision-support journey, written up the way I’d write up an incident. Pick a case, then follow the number from the first signal to the impact. Internal data stays private; the method doesn’t need it.

Every flag comes with a reason

Replaced manual monthly metric reviews with statistically routed, explainable anomaly flags.

Signal

Monthly metric checks relied on people inspecting dashboards and on fixed thresholds, which stop working in a market that keeps growing.

Investigation

A steady series and a trending series need different tests. One rule for both either misses real breaks or cries wolf.

Fix

An Augmented Dickey-Fuller test sorts each series first, then routes it to z-score, median-absolute-deviation or percentage-change rules. Each result is one flag with a plain-English reason.

Impact

Validation is repeatable and auditable, and results publish straight to the people who use them.

Python, pandas, statsmodels, Presto, Google Sheets API

Same-day alerts instead of month-end surprises

Data issues now reach the team on the day data lands, not after reports are wrong.

Signal

When ingestion broke, nobody knew until month-end reporting already looked wrong.

Investigation

Breaks showed up as sudden drops in counts against each source’s own history, so a per-source baseline was the right yardstick.

Fix

Anomaly SQL across 15+ ingestion tables compares counts with a 6-month rolling mean and standard deviation, sorts drops by severity, suppresses repeats and posts Slack alerts with trend context and root-cause links.

Impact

Detection moved from month-end to the day of ingestion.

SQL (Presto), pandas, Slack API, Hive

Rebuilding a dashboard estate from Tableau to Flask

Heaviest pages load about 65% faster, with data-quality checks and sign-off the old workbook couldn’t support.

Signal

A nine-dashboard Tableau workbook was slow, hard to extend, and had no place for the validation workflow analysts needed.

Investigation

Most of the slowness came from live warehouse queries on every page view, and the business logic was locked inside 55 calculated fields.

Fix

I rebuilt every calculation as a tested pandas metrics layer behind Flask, fed by 13 scheduled Presto extracts with caching. I then added a 14-check data-quality monitor and an 8-state analyst sign-off workflow.

Impact

About 65% faster on the heaviest pages, no live warehouse queries when someone opens a page, and sign-off that used to live in loose spreadsheets.

Flask, pandas, Plotly, Presto, SQLite

Finding which pipeline stage broke the number

Counts traced through every stage across 213 warehouse tables, so a break points to one stage.

Signal

When a number moved, nobody could say which stage of the pipeline caused it.

Investigation

Distinct counts should be conserved, or change predictably, from one stage to the next. Wherever that stops being true is where the break is.

Fix

A dashboard follows counts through ingestion, deduplication, matching, classification and fact tables, with stage-to-stage checks and banded thresholds.

Impact

Breaks are localised to a single stage, backed by 27 unit tests.

Flask, pandas, Plotly, custom SVG, Presto, pytest

From “the market looks off” to a brief

Scorecard journeys and root-cause packs that take a strategy lead from a moving number to a cause. Method only, with no confidential figures.

Signal

A market looks off on the scorecard. Before anyone reacts, the first question is whether the movement is real.

Investigation

Split the movement into coverage (are we seeing the stores?) and conversion or mix (are orders really shifting?). Rule out a data artefact before blaming the market.

Fix

Scorecards that go from market scan to diagnosis to drill-down without ad-hoc SQL, and deep-dive packs that open with a verdict, then the evidence, then the next step. Recurring investigations became one-click drill-downs.

Impact

The conversation moves from “is the number right?” to “what do we do about it?”, and validated issues reach stakeholders in plain language.

SQL (Presto), Python, Flask, Plotly

Recognition for this work

Indium certificate of recognition, Monthly Awards: Customer Champion, presented to Adarsh Chikkaswamygowda for best performance and commitment in his current assignment
Customer Champion Monthly award from Indium, my employer For best performance and commitment on my Uber assignment, signed by Indium’s CEO, COO and the SVP for the Uber account.
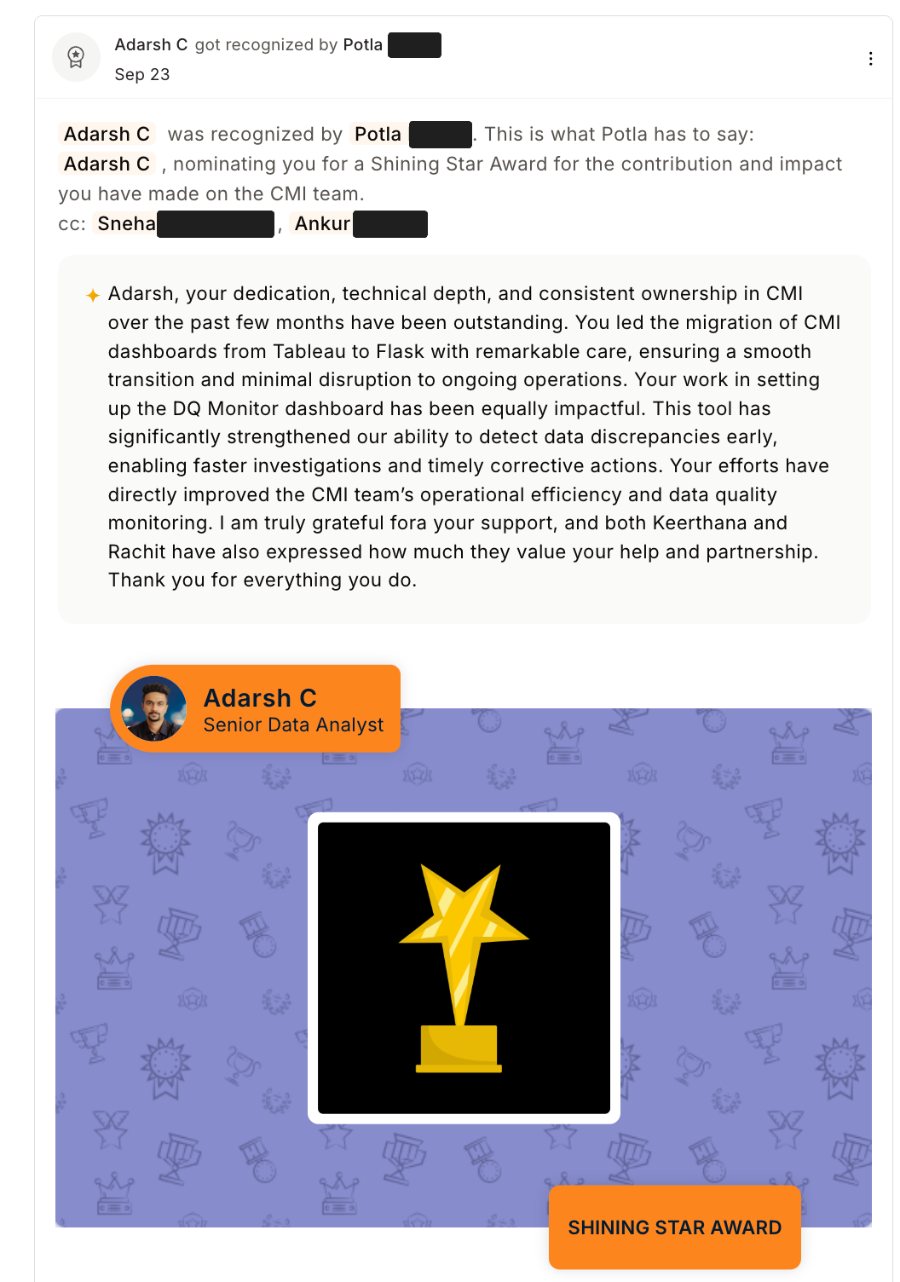
Shining Star Award recognition from Potla N. at Uber Eats, praising Adarsh for leading the migration of CMI dashboards from Tableau to Flask and setting up the DQ Monitor dashboard
Shining Star Award “You led the migration of CMI dashboards from Tableau to Flask with remarkable care.” Potla N., Uber Eats · September 2026
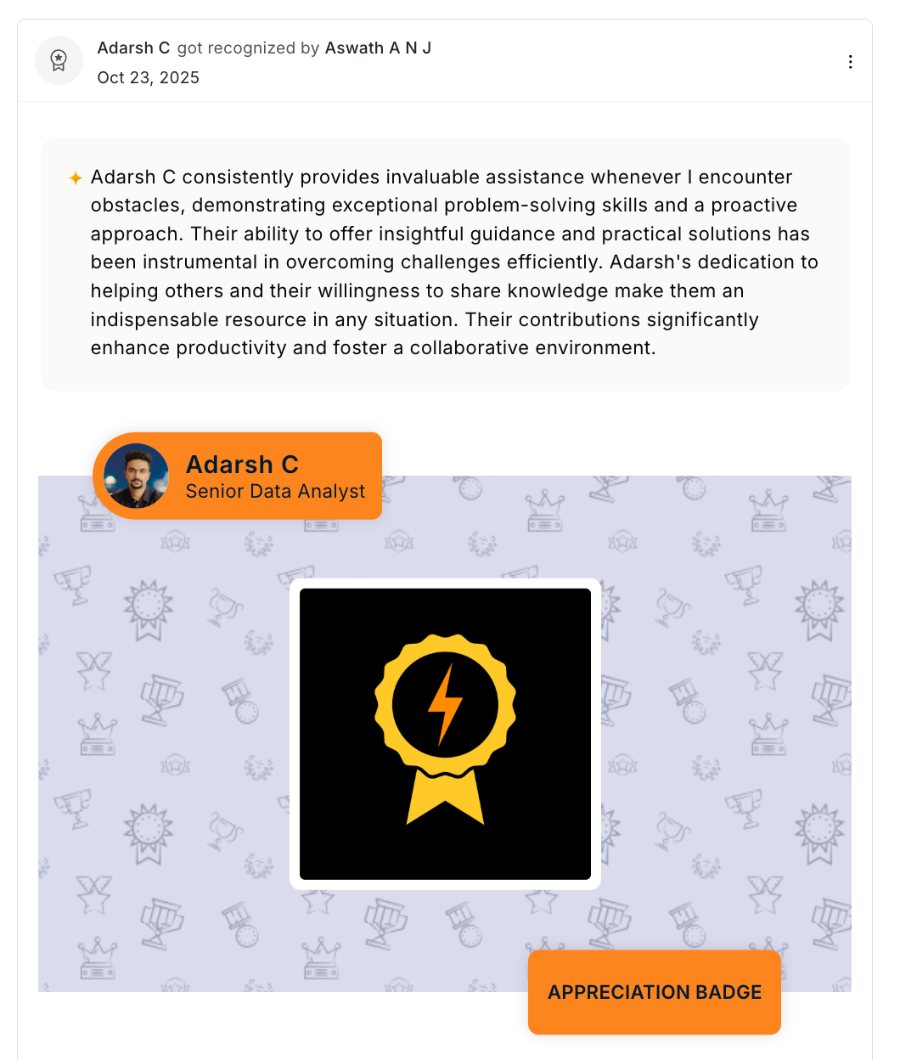
Appreciation badge from Aswath A. at Uber Eats, praising Adarsh's problem-solving skills and proactive help
Appreciation badge “Exceptional problem-solving skills and a proactive approach.” Aswath A., Uber Eats · October 2025

Chapter 3 · How I think

Five steps, any question

The same five steps whether it’s a one-off question or a production system. Pick a question to see them applied.

  1. Pin down the question

    What decision will this number change, and for whom?

  2. Define the metric

    Write down exactly what counts, what doesn’t, and why, before any SQL.

  3. Build it

    SQL and Python, drafted with AI coding agents from a written spec.

  4. Prove it

    Reconcile against sources, test edge cases, and log every decision.

  5. Watch it

    Ship it with its own checks and alerts, so I hear about problems first.

Communicate. Proving a number includes making it understood: stakeholder-ready dashboards and plain-English callouts, not only a passing test.

I don’t consider an analytical solution complete when the query runs or the dashboard loads. It is complete when the numbers are validated, the business understands them, and the process can be trusted repeatedly.

Where AI fits

I use Cursor and Claude every day to write first drafts of SQL and pandas from a written spec, and to speed up root-cause digging. A spec document, a dated decision log and unit tests decide what actually ships. That’s how one analyst can run about 20,000 lines of production analytics code.

  1. Spec
  2. Draft
  3. Review
  4. Validate against sources
  5. Tests and decision log
  6. Ship

Production use is Cursor and Claude. NotebookLM powers my independent CaneIQ case. My Prompt Engineering certification supports the workflow, not a claim that I ship LLM products.

Habits you’ll see in the work

  • Stationarity-aware detection: test first, then pick the rule
  • Conservation checks across pipeline hops
  • Baselines from a series’ own six-month history
  • User-journey dashboards
  • Verdict-first deep dives
  • Levers for stakeholders, not chart decoration

Chapter 4 · Beyond the day job

Speaking and learning

Where I share what I’ve learned about data, and keep learning, outside my day job.

Talks

Group Futurista speaker banner for the Future of Data Visualization Summit 2024, introducing Adarsh Chikkaswamygowda, Data Analyst at Tesla Gigafactory, 6 June 2024, Park Inn by Radisson Alexanderplatz, Berlin
The organiser’s speaker banner

Invited keynote Future of Data Visualization Summit 2024 · Group Futurista · 6 June 2024 · Berlin

Innovative Use Cases of Interactive Dashboards in Data Visualization

Group Futurista invited me to give a keynote at their summit at the Park Inn by Radisson Alexanderplatz in Berlin, alongside speakers from several other organisations. I talked about how interactive dashboards help stakeholders understand complex information and make better decisions, then took questions on where interactive data visualization tools are heading.

Read the post on LinkedIn

Certifications

SWAYAM online course certificate in Prompt Engineering awarded to Adarsh C, consolidated score 86.5%

Certificate SWAYAM, Government of India · July 2026

Prompt Engineering

A three-credit course from JAIN (Deemed-to-be University), Bengaluru, with IIM Bangalore as national coordinator. I passed the proctored exam in June 2026 with a consolidated score of 86.5%. It sits behind how I work with AI coding agents every day.

Also certified in

  • Tableau
  • SQL Database with Python
  • Statistical Data Analysis using Python
  • Introduction to Data Analytics
  • Business Forecasting and Predictive Modelling

Chapter 5 · Building on my own time

Independent projects

Work I do on my own time, start to finish. The first one is complete; the rest are in progress, built on public or simulated data as practice rather than as work for any employer, and links go up as each one ships.

Completed Independent business case · Mysore · June 2026

CaneIQ: an AI co-founder for a ₹2 lakh decision

Before putting ₹2 lakh into a premium sugarcane juice shop, I built a NotebookLM decision system where five AI agents challenged every assumption.

Infographic

What went in

  • 3 competitor shops visited and photographed
  • ₹550–700 per quintal of cane, from supplier quotes
  • ₹55–90k machine price range from vendor research
  • 50–250 customers a day, across four demand scenarios
  • ₹20–30k monthly rent estimates
  • Founder notes and questions, each tagged by confidence
5 AI agents in NotebookLM
  1. Load
  2. Pressure-test
  3. Audit
  4. Decide

What came out

30-day go/no-go launch blueprint

  • OpportunityVisible hygiene earns a price premium
  • OpportunityRivals struggle in the lunch rush
  • RiskMonsoon could stretch the payback
  • RiskHerb-heavy menus put customers off
  • ValidateCount footfall 12 h a day for 3 days

Mind map

CaneIQ₹2 lakh go/no-go

Market

  • Office and tech professionals
  • 50 to 250 customers a day, by scenario
  • Lunch rush, 11 AM to 3 PM

Money

  • Machine ₹55k to ₹90k
  • Rent ₹20k to ₹30k a month
  • Payback at risk in the monsoon

Competition

  • 3 premium shops visited
  • Herb-heavy menus put people off
  • Service gaps at peak

Operations

  • Cane ₹550 to ₹700 a quintal, daily
  • First-in, first-out stock
  • Hygiene routine and waste removal

AI agents

  • Investor · Competitor · CFO
  • Consultant · Founder advisor
  • Facts kept apart from assumptions

AI agents

  • Investor

    AskedIs ₹2 lakh worth the risk, and what has to be true first?

    RaisedDon’t buy equipment until a 12-hour, 3-day footfall count backs the location.

  • Competitor

    AskedWhy would anyone switch from the shops already there?

    RaisedRivals’ medicinal-herb menus backfire, and their service breaks in the 11 AM to 3 PM rush.

  • CFO

    AskedDo the costs, break-even and payback hold up?

    RaisedFlat 100-a-day demand ignores the monsoon, and juicer power costs were never benchmarked.

  • Business consultant

    AskedCan a 10×10 ft shop run cleanly every single day?

    RaisedFirst-in, first-out cane stock, a hygiene routine, daily waste removal and an FSSAI licence first.

  • Founder advisor

    AskedWhat can’t an analyst with no food-business background see?

    RaisedHidden commercial-kitchen risks. Make hygiene visible; it’s what lets you charge more.

Assumption versus evidence

Tap a card to see what the analysis found.

NotebookLM, multi-agent prompting, spreadsheets, field observation

In progress

  • In progress

    Bangalore food delivery landscape

    Which neighbourhoods are over- or under-served, and how price relates to rating, using public restaurant listings.

    SQL, dbt, DuckDB, Python

  • In progress

    Free-delivery threshold experiment

    Designing and reading an A/B test on simulated orders: sample size, guardrail metrics, and a clear ship-or-don’t call.

    Python, statsmodels, SQL

  • In progress

    Data checks before you trust a table

    A small open-source Python toolkit for the checks I run first: duplicates, gaps, drift and reconciliation.

    Python, pandas, pytest

Tools I use

Query and process production
Advanced SQL (Presto, Trino, Hive, SQL Server, SQLite), Python, pandas, NumPy
Statistics and ML production
statsmodels, ADF, z-score, MAD, Tukey IQR, rolling baselines, correlation, scikit-learn for segmentation
Show production
Tableau (LOD, parameters, drill-downs), Power BI, Plotly, Matplotlib and Seaborn, Excel macros and VBA, Google Sheets
Apps and engineering production
Flask, Jinja, REST and JSON, Slack API, Google Sheets and Drive APIs, SSIS, pytest, Git, scheduled extracts, caching
Work with people
Metric definitions, root-cause analysis, self-serve analytics, analyst sign-off workflows
AI workflow
Cursor and Claude as governed coding agents, NotebookLM (CaneIQ), Prompt Engineering certification
Practising side projects
dbt, DuckDB and experiment design on public or simulated data. Practice, not claimed as production.

Epilogue · The next chapter

Let’s write the next chapter

I’m open to senior analyst roles in India and across Europe, including relocation. I speak English, Kannada and Hindi, and German at A2.